고정 헤더 영역
상세 컨텐츠
본문

알리(권투선수 알리가 생각난당. 모를깡?)차트는
진정 레고 처럼 참으로 객체 지향적으로 잘 설계 되었당.
하나 기억해야 할 꺼이 있는데, Recharts는 SVG로 이루어졌당.
문서도 한글이 아니어서 그렇지, 그저 아래 링크를 따라만 하는 것으로 그 메인 맥락을
갖고 싶던 맥미니를 선물받은 느끼미처럼 강렬하지 아니하다 아니할 수 없당.
https://recharts.org/en-US/guide/getting-started
거두절미(생선은 불쌍하당!!~~) 하고, 시동(설치, 나 지금 설치냥?) 걸고 엑셀 발바보장!
npm i recharts
그럼 기본 LineChart로 Recharts에 담긴 레고 철학을 먼저 느껴보장
JunyLineChart.jsx
import { Line, LineChart } from "recharts"; const junyFriends = [ { name: "나믈친", age: 27, tall: 185, weight: 80 }, { name: "사나니", age: 24, tall: 190, weight: 46 }, { name: "세이니", age: 25, tall: 175, weight: 43 }, { name: "영시니", age: 23, tall: 170, weight: 41 }, { name: "지혀니", age: 24, tall: 165, weight: 44 }, { name: "현주니", age: 22, tall: 171, weight: 70 }, { name: "E7E니", age: 70, tall: 95, weight: 72 }, ]; function JunyLineChart() { return ( <LineChart width={800} height={500} data={junyFriends}> <Line type={"monotone"} dataKey={"tall"} stroke="#B20CE0FF" strokeWidth={2} /> </LineChart> ); } export default JunyLineChart;
App.jsx
import JunyLineChart from "./JunyLineChart"; function App() { return ( <div style={{ border: "10px groove gold", width: 800, margin: "2px auto", textAlign: "center", }} > <h1 style={{ color: "#023210BA" }}>추우니 알리차트</h1> <JunyLineChart /> </div> ); } export default App;
결과는 이러할거시당. (아님 오리무중이 기거한다는 오리둥절이당)

type={"monotone"} 부분에 Ctrl + Space를 눌러, 어떤 타입들이 제공되는지 누느로 찍자
이제 차트 뒤에 바둑판(네모 쩜쩜...)을 깔아보장.
JunyLineChart.jsx
// ... 위 생략 function JunyLineChart() { return ( <LineChart width={800} height={500} data={junyFriends}> // ....생략 <CartesianGrid stroke="#ccc" strokeDasharray={"4 4"} /> // 얘만 너으면 된당. </LineChart> ); }
결과는 스킵이당. (눈으로만 보장...캡쳐는 마느면 중노동이당)
strokeDasharray는 값을 키워가면서 결과를 모니터링하면 시그니처를 남긴당.
이젠 X와 Y축을 괜시리 넣어보장.
JunyLineChart.jsx
// ... 위 생략 function JunyLineChart() { return ( <LineChart width={800} height={500} data={junyFriends}> // ....생략 <CartesianGrid stroke="#ccc" strokeDasharray={"4 4"} /> <XAxis dataKey={"name"} /> // 요거랑 요 아래 줄 <YAxis /> </LineChart> ); }
결과는 역시 널뛰기 스킵이당. 줄줄이 당근이니깡~~
이제 ToolTip만 너어보면 느끼미가 찾아오지 아니 하지 아니 할 수가 없당.
[만약 찾아오지 아니 하지 않았다면, 그러면 당신은 꾸믈 꾸어버린, 꾸믈꾼이당]
JunyLineChart.jsx
// ... 위 생략 function JunyLineChart() { return ( <LineChart width={800} height={500} data={junyFriends}> // ....생략 <CartesianGrid stroke="#ccc" strokeDasharray={"4 4"} /> <XAxis dataKey={"name"} /> <YAxis /> <ToolTip /> </LineChart> ); }
필히 느끼미가 찾아왔을 터이니, 이제 tall 말고, weight, age 라인도 넣어보장.
JunyLineChart.jsx
//... 생략 function JunyLineChart() { return ( <LineChart width={800} height={500} data={junyFriends}> // 아래 3 라인이 변절자 <Line type={"step"} dataKey={"tall"} stroke="#4228EAFF" strokeWidth={2} /> <Line type={"bump"} dataKey={"age"} stroke="#B641D7FF" strokeWidth={2} /> <Line type={"bump"} dataKey={"weight"} stroke="#248916FF" strokeWidth={2} /> //... 생략 <Tooltip /> </LineChart> ); }
결과야 당근꾸러미로 아하!~~ 하고 잘 될꺼이당.
이제 브라우져 사이즈에 맞게(정확히는 부모 사이즈 변화에 변화) 해주는 은근 반응형
ResponsiveContainer 와 기준선을 넣어 줄 수 있는 ReferenceLine 을 추가하면서
부모 사이즈 속성에 영향 받으므로 App.jsx를 살짝만 고치장.
[ 첨부터 잘 했어야징.... 스스로 혼내기.. 유체이탈... ]
App.jsx
import JunyLineChart from "./JunyLineChart"; function App() { return ( <div style={{ border: "10px groove gold", minWidth: 400 /* 요기만 고침 */, margin: "2px auto", textAlign: "center", }} > <h1 style={{ color: "#023210BA" }}>추우니 알리차트</h1> <JunyLineChart /> </div> ); } export default App;
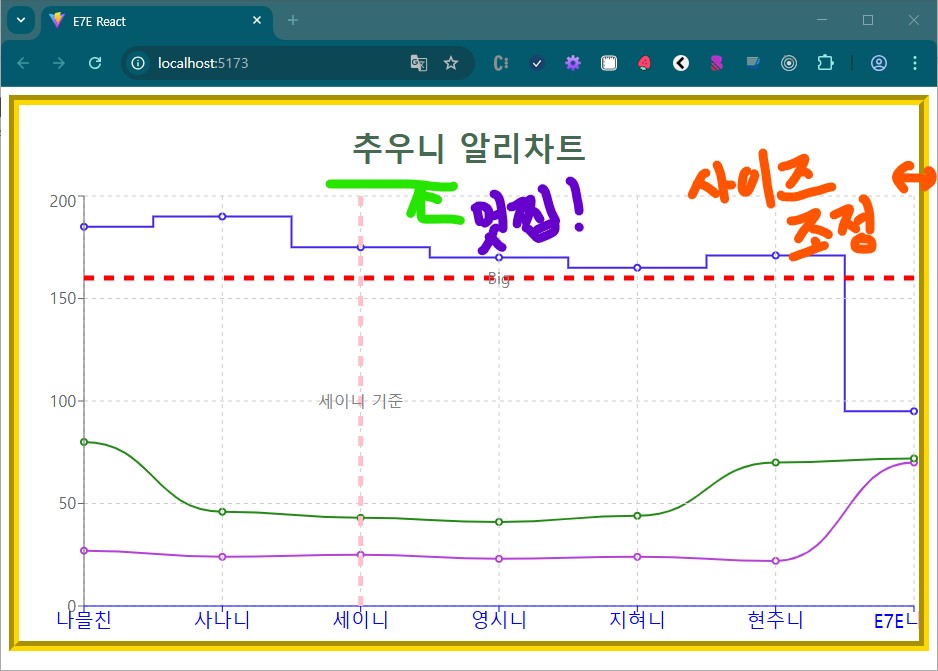
JunyLineChart.jsx (이거이 일단 final)
import { CartesianGrid, Line, LineChart, ReferenceLine, ResponsiveContainer, Tooltip, XAxis, YAxis, } from "recharts"; const junyFriends = [ { name: "나믈친", age: 27, tall: 185, weight: 80 }, { name: "사나니", age: 24, tall: 190, weight: 46 }, { name: "세이니", age: 25, tall: 175, weight: 43 }, { name: "영시니", age: 23, tall: 170, weight: 41 }, { name: "지혀니", age: 24, tall: 165, weight: 44 }, { name: "현주니", age: 22, tall: 171, weight: 70 }, { name: "E7E니", age: 70, tall: 95, weight: 72 }, ]; function JunyLineChart() { return ( <ResponsiveContainer aspect={2}> <LineChart width={800} height={500} data={junyFriends}> <Line type={"step"} dataKey={"tall"} stroke="#4228EAFF" strokeWidth={2} /> <Line type={"bump"} dataKey={"age"} stroke="#B641D7FF" strokeWidth={2} /> <Line type={"bump"} dataKey={"weight"} stroke="#248916FF" strokeWidth={2} /> <CartesianGrid stroke="#ccc" strokeDasharray={"4 4"} /> <XAxis dataKey={"name"} fontSize={"1.2em"} fontWeight={"border"} stroke="blue" /> <YAxis /> <Tooltip /> <ReferenceLine x="세이니" stroke="pink" strokeDasharray={10} strokeWidth={5} label="세이니 기준" /> <ReferenceLine y="160" stroke="red" strokeDasharray={10} strokeWidth={5} label="Big" /> </LineChart> </ResponsiveContainer> ); } export default JunyLineChart;
aspect는 문서에 width / height라 되어있으닝, width를 height보다 2배로 유지하란 야기
느끼미 친구가 꼬끼오 당신을 차자갔길...
나의 결과 화면은 아래하다. (캡처가 별로지만, 화면 사이즈 조정을 해보길....)
오늘은 요기까지만 하공, 낸중에 커스터마이징 해보아용~~
올록볼록 미러에 접촉사고로 샤방샤방 폭발하던 햋빛처럼
옴팡지게 단단하게 빛나던 그 시절 울마님
모든 날 모든 순간 함께 할 수 없었던 기다림에
그리움은 보고싶다가 보고싶다로 도돌이다
뒤 돌아가 보니 마님을 졸졸 따라 다니던
그 모든 날 모든 순간들 뒤로 웃음이 졸졸 흐른다.
시간은 공간에 남은 기억과 감정을 트랜스폼한다.
졸졸 흐르는 그 모든 날 모든 시간
마니 웃었던 시간, 꽤나 간직하고 싶던 시간,
다시 마주하고 싶지 않던 우울하고 찌질했던 시간
그 모든 날, 모든 시간에 답이 되어 준 그사람
... ... ...
https://www.youtube.com/watch?v=nq0BYGyH2Do
'React' 카테고리의 다른 글
| React(리액트) 티키타카 33 (wx-react-gantt) SVAR Gantt (3) | 2025.03.27 |
|---|---|
| React(리액트) 티키타카 32 (motion) 애니메이션 (0) | 2025.03.26 |
| React(리액트) 티키타카 30 (SweetAlert2) (0) | 2025.03.24 |
| React(리액트) 티키타카 29 (CkEditor) (0) | 2025.03.22 |
| React(리액트) 티키타카 28 (tanstack useInfiniteQuery) (0) | 2025.03.19 |
e7ee7e 님의 블로그입니다.


